There are some very legitimate studies that suggest there has been no global warming for the last ten years and they would be right, to an extent. Yes temperatures have leveled out since 1998. However, these numbers are still way above the norms set prior to 1998. If I average a bunch of high numbers that remain constant the level of rise will be near non-existent, thus the idea that temperatures are not rising. However, if I factor in numbers prior to 1998, the level of rise is significant and dangerous.
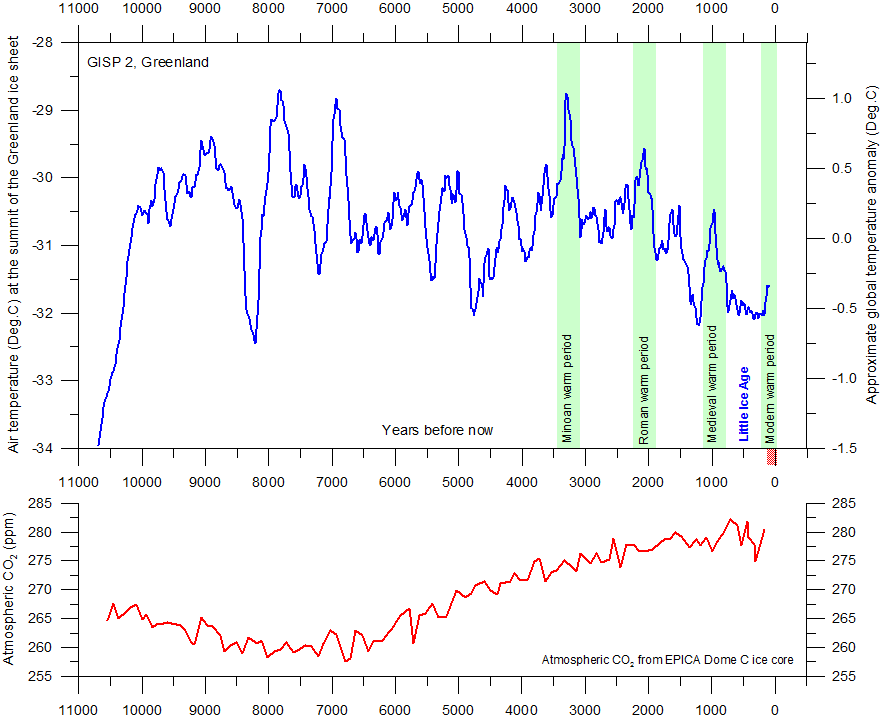
The canaries in the coal mine are Greenland, the Arctic and Antarctica, all of which have seen temperature rises of three to six degrees over the last fifteen years. These areas are long considered to be the harbinger of temperatures to come in the next decade and, if true, we are in lots of trouble. Temperatures can increase that much over a thousand years with little damage but such a spike in say a fifteen year period is a disaster waiting to happen.

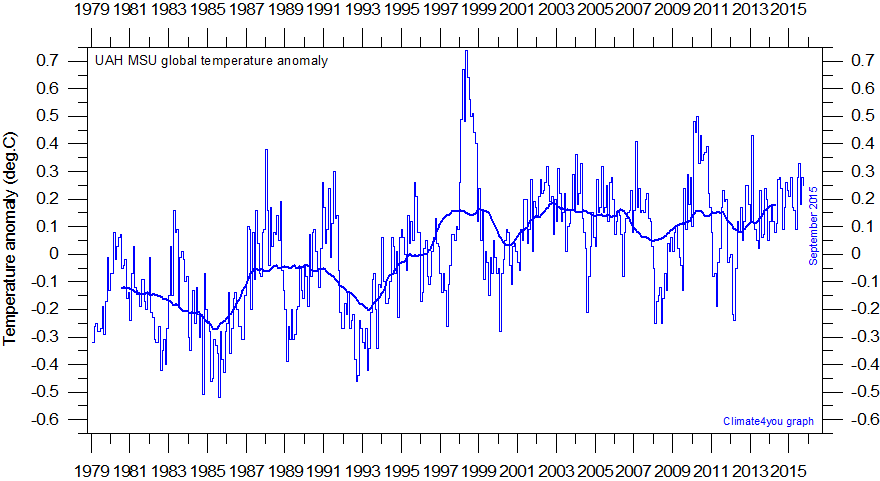
In the charts above, we can see there is little doubt that temperatures have increased significantly over the last few years. The good news is that Greenland research has suggested that higher temperatures would be needed for a catastrophic ice melt but should we really be tempting fate by doing nothing?

In this chart, temperatures are taken from satellites and the rise is unmistakable. 1998 saw a huge spike in temperatures in 1998 due to a strong El Nino and a temperature plunge in 1991 due to the eruption of Mt. Pinatubo. The thing you will notice most from the graph is that temperatures have been rising steadily until 2003 where they have leveled out, again at a noticeably higher level though than previous norms of the past few decades.
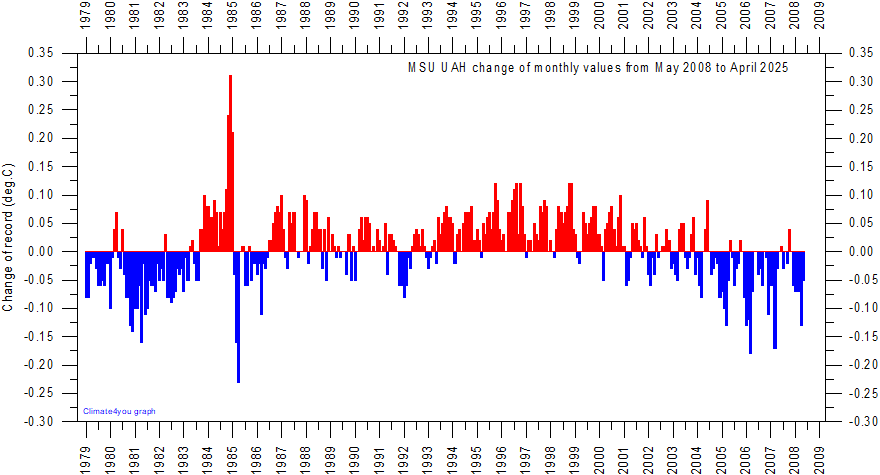
Next let us talk about statistics. I keep hearing that each individual weather phenomenon is not a sign of global warming and they would be right. However, if extreme weather patterns keep happening beyond the realm of chance then you have a statistical anomaly and not random weather. Take a wild guess which is right? If you said beyond the realm of chance you would be right.

In the chart above we can see weather patterns remaining stable until 1998. After that we see wild swings in temperatures both high and low. Worse, the pendulum is swinging father and farther away, causing more temperature extremes and wild weather.

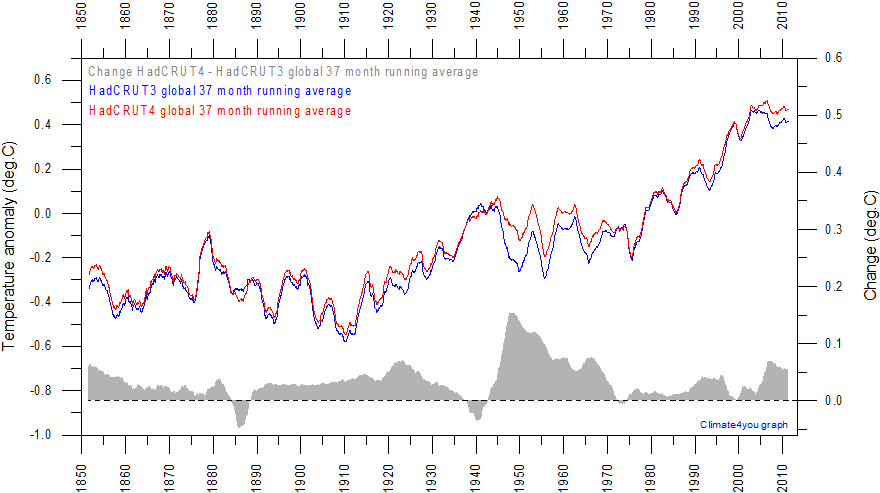
In this graph, which goes back to the 1850's, we can clearly see temperatures are rising significantly since 1980. The only leveling off we see is one that much, much higher than previous norms. Yet people with no knowledge of science or statistics keep making these grand statements about temperatures leveling off when in reality they have only done so on a mean average and not on a grand scale.
If I flip a coin, it's 50/50 that it will come up heads or tails. However, if I keep flipping one side or the other constantly, say heads a dozen times, the chances of me flipping heads again drop dramatically. But to an observer who has only seen me flip the coin the one time, for him, it is 50/50 again, even though it isn't. That's what these graphs are like. People are only looking at it from a limited perspective and not seeing the whole picture by only addressing climate change over the last decade and not over say the last century where statistics paint a very different picture.
These past few weeks have seen two F5 tornadoes in the same state, Oklahoma, including last week's that was a record breaker for size and strength. F5's happen less than one percent of the time so to have two hit the same are within 11 days is an anomaly. Like the flipped coin, if this was the only weather issue, statistically it would mean nothing. But when taken into account the sheer number of other weather problems world wide in just the last few weeks, a much more troubling pattern emerges.
Europe is experiencing record flooding not seen in seventy years. On Memorial Day, several feet of snow fell on upstate NY and VT. April was so cold that 1100 records were broken nationwide. By the way, for every cold record we break, ten more heat related ones take it's place, further suggesting temperature rises. But that doesn't mean cold records aren't being broken world wide because they are. Moscow had it's worst snow fall in 100 years, as did Anchorage AL. Boulder sized hail fell on one province in India, leveling a village. We have seen record rainfall and flooding in San Antonio, TX. And while Chicago and Georgia have experienced extremely wet springs, the drought in the Midwest is expected to intensify. Australia is experiencing record heat as we speak while California continues to burn which is odd as wildfires usually appear in the fall. The cherry on top is that recent studies show that 2012 has the hottest year on record ever. Over 34,000 daily heat records were broken while less than 7000 were record lows. This backs up the graphs from above.
All this means is that storms are going to get worse, temperatures are going to get higher and more people are going to die, especially along the coast. Climate change is real and it is happening. Anyone who says differently is a liar, a moron or both. Which are you? And, more importantly, what do you plan to do about it?
I fundamentally disagree with the above. I am a scientist and have been forced to study statistics for over four years (in fact I liked it).
ReplyDeleteI could give you a lot of arguments to state why i disagree, but I will not.
This discussion is no longer about science, it is about religion. And if you doubt the true Lord (Global Warming) than you are suspect at least.
Scepticists have been accused of 'cherry picking' the data, whereas that is a speciality of those in favour of global warming. People claiming that scepticists lack statistical insights show charts with 13 year running averages to show that there is no cooling since 1998. Yeah right, how could it show up in such a graph?
The whole reasoning of the IPCC shows severe flaws and dear Warmonger, you should be able to notice. If you only would have the guts. It is like becoming an atheist, scary huh?!